Analyzing the Nasdaq 100 Futures Live Chart effectively is one of the most crucial skills a trader can develop to make informed and profitable decisions. Futures trading is highly dynamic, and the Nasdaq 100 index, which tracks the performance of 100 of the largest non-financial companies listed on the Nasdaq Stock Exchange, offers tremendous opportunities for active traders. By learning how to interpret live charts correctly, traders can identify market trends, understand price movements, and make better entry and exit decisions.
Understanding Nasdaq 100 Futures
Before diving into chart analysis, it’s essential to understand what Nasdaq 100 futures are. These are standardized contracts that allow traders to speculate on the future value of the Nasdaq 100 index. Each futures contract represents a certain portion of the index and moves in tandem with the underlying market. Futures trading provides several benefits such as leverage, liquidity, and the ability to trade nearly 24 hours a day.
When traders view the Nasdaq 100 Futures Live Chart, they’re essentially watching real-time data that reflects how investors are pricing the index for future delivery. Price movements on the chart represent the collective sentiment of market participants regarding the tech-heavy Nasdaq index.
Why Analyzing Live Charts is Important
The Nasdaq 100 Futures Live Chart provides immediate insights into market direction, volatility, and momentum. Unlike delayed data, live charts allow traders to react quickly to news events, economic reports, and technical setups. For short-term traders and scalpers, real-time analysis can mean the difference between profit and loss.
Live charts help traders:
- Spot emerging trends before they mature
- Identify potential reversals or breakout opportunities
- Time entries and exits with higher precision
- Measure volatility and adjust position size accordingly
The ability to read and analyze live data ensures traders are always aligned with the current market rhythm rather than lagging behind.
Key Components of the Nasdaq 100 Futures Live Chart
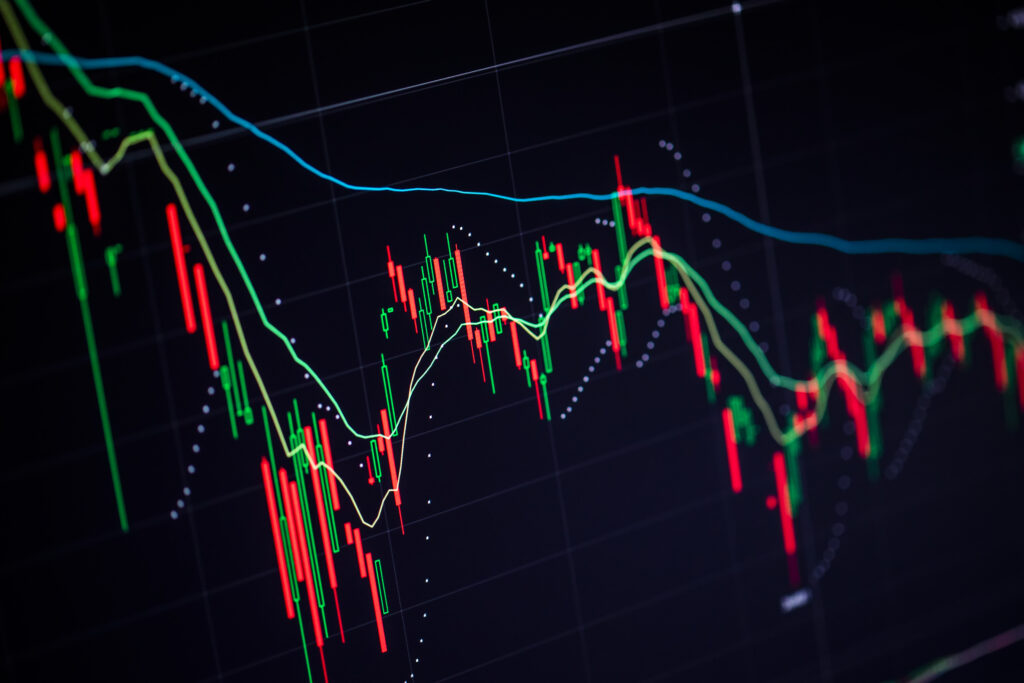
Price Candlesticks
Candlesticks are the foundation of technical analysis. Each candlestick shows four key data points — opening price, closing price, high, and low — within a specific time frame. The color of the candlestick (usually green for bullish and red for bearish) immediately shows whether buyers or sellers dominated that period.
By analyzing candlestick patterns such as dojis, hammers, engulfing patterns, or shooting stars, traders can anticipate market reversals or continuation signals.
Time Frames
The Nasdaq 100 Futures Live Chart can be viewed in multiple time frames ranging from one minute to one day or even weekly intervals. Shorter time frames are used by day traders for quick decisions, while longer time frames are suitable for swing or position traders. Aligning multiple time frames helps confirm the strength and direction of trends.
Support and Resistance Levels
Support levels indicate where prices tend to stop falling and reverse upward, while resistance levels show where upward moves usually pause or reverse downward. Identifying these levels on the live chart helps traders plan entry and exit points.
A strong break above resistance can signal a new bullish phase, while a break below support may confirm bearish momentum.
Trend Lines and Channels
Drawing trend lines on the Nasdaq 100 Futures Live Chart helps visualize the direction of the market. Uptrends are marked by higher highs and higher lows, while downtrends show lower highs and lower lows. Channels, formed by parallel trend lines, help traders identify potential buy and sell zones within the ongoing trend.
Moving Averages
Moving averages smooth out price data and reveal the underlying trend. The most commonly used are the 50-period and 200-period moving averages. When the shorter moving average crosses above the longer one, it signals a potential bullish trend, while the opposite suggests a bearish reversal.
Volume Analysis
Volume shows the number of contracts traded during a given time. Analyzing volume along with price movements can confirm the strength of a trend. For instance, if the price breaks out above resistance on high volume, it indicates strong buying pressure.
Using Technical Indicators on the Nasdaq 100 Futures Live Chart
Technical indicators enhance chart analysis by providing mathematical insights into market behavior.
Relative Strength Index (RSI)
RSI measures the speed and change of price movements. It ranges from 0 to 100. Readings above 70 suggest the market may be overbought, while below 30 indicates oversold conditions. Traders use RSI to identify potential reversal zones.
Moving Average Convergence Divergence (MACD)
MACD helps identify changes in momentum and trend direction. When the MACD line crosses above the signal line, it’s considered bullish; when it crosses below, it’s bearish.
Bollinger Bands
Bollinger Bands consist of a moving average and two standard deviation lines. They expand during periods of high volatility and contract during consolidation. Prices touching the upper band may indicate overbought conditions, while the lower band can signal oversold levels.
Fibonacci Retracement
Fibonacci levels help traders find potential reversal areas after significant price movements. Common retracement levels are 38.2%, 50%, and 61.8%. When plotted on the Nasdaq 100 Futures Live Chart, these levels act as dynamic support and resistance zones.
Interpreting Market Sentiment Through the Chart
Beyond pure technical analysis, the Nasdaq 100 Futures Live Chart also reflects market sentiment. Large bullish candles may show optimism driven by strong earnings or economic data, while long bearish candles can indicate fear or risk aversion.
Monitoring how futures react to major news events such as Federal Reserve announcements or geopolitical developments can offer clues about investor confidence.
Combining Technical and Fundamental Analysis
Although live charts primarily display technical data, combining them with fundamental insights creates a more holistic view. For example, understanding how interest rate expectations or inflation data impact technology stocks can help traders anticipate shifts in the Nasdaq 100 futures market.
When a fundamental event aligns with a strong technical setup, the probability of a successful trade increases significantly.
Developing a Trading Strategy Using Live Chart Analysis
To make the most out of the Nasdaq 100 Futures Live Chart, traders should have a structured trading plan.
- Identify the Market Bias – Use trend analysis and moving averages to determine whether the market is bullish, bearish, or ranging.
- Wait for Confirmation – Use indicators like RSI or MACD to confirm the direction.
- Set Entry Points – Identify entry levels near support or resistance zones.
- Define Stop Loss and Take Profit Levels – Protect your capital by setting risk management rules.
- Monitor Live Data – Continuously watch how price reacts to key levels or economic releases.
- Review and Adjust – After each trade, review performance and refine the strategy.
Common Mistakes Traders Make When Reading Live Charts
Many beginners misinterpret signals on the Nasdaq 100 Futures Live Chart due to emotional decision-making or lack of discipline. Common mistakes include:
- Overtrading due to constant watching of short-term fluctuations
- Ignoring higher time frame trends
- Relying solely on one indicator
- Failing to use proper stop losses
- Misreading false breakouts without volume confirmation
Avoiding these errors and sticking to a systematic approach can dramatically improve trading performance.
Final Thoughts
The Nasdaq 100 Futures Live Chart is an invaluable tool for traders aiming to stay ahead in a fast-moving market. By mastering chart patterns, understanding technical indicators, and combining real-time data with broader market insights, traders can make smarter, data-driven decisions. Success in futures trading doesn’t come from predicting every move but from interpreting the live chart correctly, managing risk efficiently, and acting decisively when opportunity strikes.